.png)
Tuesday, June 26, 2012
GBPUSD Re-entered short
GBPUSD trade stopped out on news
.png)
I'm watching for a re-entry but am waiting for a higher bounce.
Apparently the UK reduced it's Public Sector Net Borrowing to £15.6 billion form £19.9 billion and although that was not as big a reduction as was forecast.......it's still appears to be giving the £ a boost.
Monday, June 25, 2012
Update: EURGBP short trade

However, my stop loss is in place as well as my profit target so I will let the trade run it's course, in accordance with my strategy and money management plan.
Update: FTSE 100 short trade

his trade has progressed well and I have been trailing my stop all the way down (brown lines).
The price has made a lower low but the indicators are up (red lines) and this represents a bullish divergence. I am therefore expecting a retrace against the trade but my stop is in place and I hope it won't be hit so that I can participate in the onwards ride down.
In any event this has been a nice trade and I've managed it well so I am a happy with that.
Update: GBPUSD short trade

The price has made a lower low but the indicators are flat to up (red lines) and this represents a bullish divergence. I am therefore expecting a retrace against the trade but my stop is in place and I hope it won't be hit so that I can participate in the onwards ride down.
In any event this has been a nice trade and I've managed it well so I am a happy with that.
Update - ABF:LSE

I don't normally read any of the fundamentalist/analyst rubbish that is published but a press release on my broker's site today caught my eye as it was headed "ABF upgraded by UBS". Apparently UBS is recommending the company to it's clients.
This encourages me to stay short!
As you can see from the chart my original pattern is still intact and there is a new, much steeper rising wedge within the larger pattern.......I therefore stay short....and wait
New Short Trade EUR/GBP
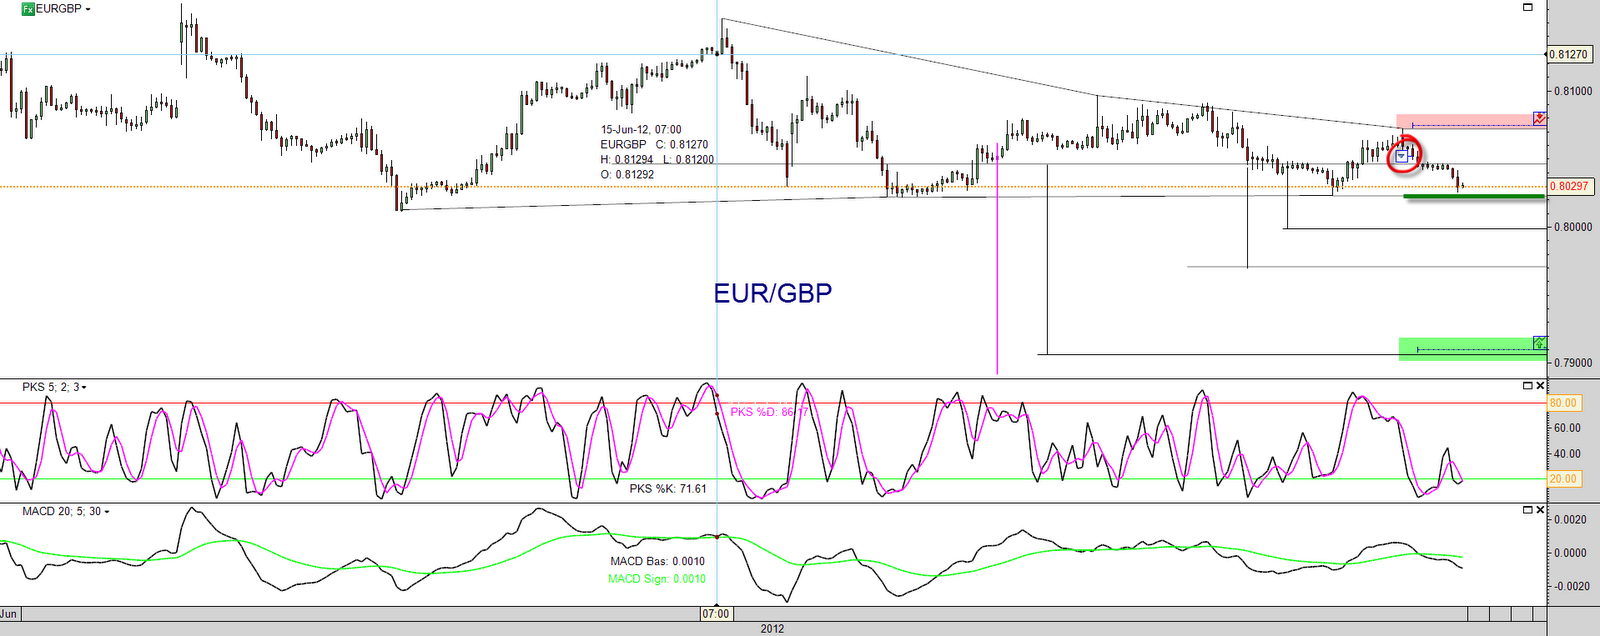
The chart shows the funnel and the thin green line shows my traditional entry point.
However, I often take what I call an "early entry" trade and this I what I have done here. The entry was just after the price action appeared to have made a clear high to form the funnel. Obviously, this is a higher risk entry than waiting for the break (or a second chance entry), but it often works well and increases the R:RR dramatically as it means your stop (red highlight) is much closer to entry but the target (green highlight) is the same as if it were a traditional entry.
Friday, June 22, 2012
GBP/USD Update
.png)
My GBP/USD Short Trade has made good progress downward.
The price action appears to be forming a bear flag pattern. There will always be retraces in any trend on whatever time frame....It's all part of trade monitoring and management.
I've moved my stop to a guaranteed profit position just above the round number of 1.5650 and my profit target down to just above the 1.5500 level.
I am holding the trade open for further downside pressure and I will monitor the price action throughout the day and move my stop order as appropriate. Depending upon how the price action develops I may move my target too but as today is Friday I will probably close out the position before the FX market closes this evening as I don't like leaving profitable trades open over the weekend
FTSE 100 Short Trade - Update

My FTSE 100 Short Trade has made good progress downward.
The price action appears to be forming a bear flag pattern. There will always be retraces in any trend on whatever time frame....It's all part of trade monitoring and management.
I've moved my stop to a guaranteed profit position just above the round number of 5550 and my profit target down to just above the 5300 level....yes....all the way down there! My target price comes from the channel which the price has formed..but has yet to break....If the price action at the channel level appears to be resisting too much, I will close the trade at the bottom of the channel instead.
Thursday, June 21, 2012
New short trade on GBP/USD
.png)
I took a new short trade on the GBP/USD pair yesterday just before I went to play golf....hence the late post.
You can see my entry point on the chart together with my stopp loss and limit order levels.
Note the direction of the indicators....all downward....
The first important level will be 1.5665 and the second 1.5600....I am expecting resistance at both these levels..but if broken the next level would be around the 1.5550, before heading down to my target.
Another short trade on FTSE
.png)
I re-entered another short trade on FTSE 100 at lunch time today. You can see the indicators confirming the downward pressure on the price and I'm hoping this will translate in to downward price action.
I will monitor the price throughout the afternoon and may move my target downwards, depending upon the price action.
Tuesday, June 19, 2012
FTSE Short Trade
My FTSE short trade has been stopped out for a full loss trade.
Ben's helicopter effect I think!
Ben's helicopter effect I think!
New FTSE Short Trade
.png)
It's a very short time frame setup and my stop and targets are as shown. MY stop is just above the 1.272 Fibonacci extension on the previous swing and targets are at R:RR of 1:1 and 2:1 respectively.
Note the bearish divergence between price and indicators as highlighted by my orange lines.
Monday, June 18, 2012

FTSE Short Trade Target met!
.png)
50 pips in 48 minutes!
ABF:LSE - Short Trade doubled in size

This pattern has been profitable but did not reach my target and I'm currently under water with it.
Given the apparent euphoria in the markets over the fact that Greece isn't going bust (yet)...I've doubled up on my size which gives me a higher average holding price and that enables me to move my profit target higher, in accordance with my startegy.
I will monitor the price action and close the trade when the new revised target is met.
Markets celebrate!...Hello?..I'm short the FTSE

So this morning the market is celebrating the fact that Greece is not going to go bust this week! The result
At one point the FTSE 100 was up around 10%.
I've gone short the index simply because nothing has changed soince Friday....OK...the Greek vote went the way the world politicians wanted.....but..hey ho...what do that do for the UK economy!....ZILCH!
The result of the Greek election gives the pro-austerity conservative and socialist parties enough votes to form a fragile and awkward ruling coalition!
Oh and by the way......also at the weekend elections the French Socialist party won a commanding parliamentary majority, giving President Hollande the power to tax and spend to his heart's desire.........
Thursday, June 14, 2012
FTSE Short trade closed for a small profit

I was stopped out and, of course, the market has dropped a little further since then.
However, always keep in mind:-
Rule 1 of trading - Don't lose money
Rule 2 of trading - Don't lose money
Rule 3 of trading - Apply rules 1 & 2
And.....a profit is not a profit until it is banked!
I am watching for another entry at the top of the funnel if the opportunity arises.
AUD/NZD closed for a profit...BUT!

However, the market was fairly volatile during his speech, and whilst my profit target was hit....the spike which did so was so rapid, that my profit take order did not get filled. Fortunately I was watching the price action whilst the Governor spoke and I was able to take a "manual" profit.
This is a very frustrating thing to deal with in the market...but it happens from time to time...and we just have to learn to deal with it and move on.
There is always the consolation that my strategy was correct...and as I placed my orders correctly, there is nothing more that I could have done...a well spotted and executed trade that just didn't work out as well (financially) as it should have.
Note that my indicators were showing a bearish divergence with price all the way from my entry point to the red vertical line which is when the price began to fall.
ABF Update
.png)
Note the divergence between price and volume....higher prices with flat or lower volume are often a sign of lower prices to come.
I hope so!
New short trade FTSE 100

I've spotted a potential Fibonacci funnel setting up on the FTSE100 cfd. I've taken an earlier entry than normal.
The benefit of this is that it reduces my risk by some 35 points....and of course, would increase my R:RR significantly if the trade is successful.
However, the downside is that by taking the entry early, I could be wrong in my view that this will be a Fibonacci funnel...only time will tell.
Wednesday, June 13, 2012
Why it pays to be a swing trader.....not a position investor
I always approach my trading as a swing trader; not a position investor. For me, preservation of capital rules above all else.
To illustrate the dangers of position (long-term buy-and-hold) investing, I read today that Anthony Bolton, the famed Fidelity fund manager, has managed to lose over 24% in his China fund in the past year.
I don’t know about you, but this type of investing just doesn’t appeal to me. It is all very well saying – or more honestly, praying – that it will do well in the future. But that smacks of rationalisation to save face.
In truth, no-one knows what a fund – or any financial market – will do in the future with anything approaching certainty. It could go down 50% or more. It could double.
My point is that a loss is a loss, and any investor who puts their faith – and it is faith – in a star manager, is in a state of denial when faced with this reality.
The pain in Spain.....and Greece...and Italy...and Portugal...and...
Whilst I am the first to acknowledge that, as a trader, I must accept that the market is always right, there are times when I can't help wondering if the rest of the world is seeing something that I am not not!
There is so much financial trouble in the Eurozone...and in the USA...that to me, it is almost inconceivable that the markets can rise and take out previous highs.....but the bulls are still in there, fighting hard and it's a case of "wait and see" who wins the battle.
I, for one, will not be joining the bullish camp until my charts, patterns and indicators tell me to do so....until then..I'm staying on the short side.
New short trade NZD/USD
.png)
The price has been in a rising uptrend for most of June and is currently running along the mid line. However, my indicators are showing a bearish divergence and the price is approaching the round number of 0.7800.
The Bank of New Zealand issues it's Official Cash Rate and, more importantly, it's press conference and rate statement at 10p UK time tonight and this may produce some volatility in the price action and of course this could stop me out.
However, It is often the case that my indicators lead the price action so I'm banking on the bearish divergence.
.png)
ABF - Update
.png)
The trade has now gone against me and I also suffered a bullish divergence against the trade as highlighted by the orange lines.
However, my trade is still running in accordance with my money management strategy and I am now hoping for some strong price resistance as indicated on the chart.
Back from my European Tour
.png)
.png)
.png)
2,200 miles and 9 countries in 9 days!
If you are into motorbiking, the Alps are a fantastic place to ride!
Thursday, May 31, 2012
No updates for a few days.......European Motorcycle Tour
.png)
.png)
It normally rains when we are away...but the roads are great for biking and the scenery is fantastic, so getting wet is a price well worth paying.
If you're a trader..I wish you good trading!
ABF: Update
.png)
I will be alerted if the price hits my first target and I will then sell half of my holding, move the stop to break even and run the remainder in the hope that my second target will be reached.
In the meantime, my protective stop is in place.
USD/SEK closed for a profit
.png)
FTSE Short Trade closed for a profit
.png)
Facebook : My final thoughts
Since there is more interesting things to concern myself with as a Trader, I'd just like to add the following:
Facebook’s stock is down 29% since
it opened at $42.05 per share on May 18. This grim result is causing a lot of
howling about the IPO process and those “damn Wall Street banks.
Of course, you could take the view that investors who fool around with hyped
IPOs get what they deserve. My sympathies lean in that direction. If you play
with fire, you might get burned.
Regardless, I agree with this comment in
yesterday’s Wall Street
Journal:
|
What could have been a model example
of the market’s strengths — an eight-year-old company with 900 million users
raising billions of dollars from a cross-section of the investing public —
ended up as a case study of the power wielded by insiders over outsiders.
|
In short, Facebook is another black eye for a market that already has a lot of black eyes. In the last dozen years, we've suffered through two 50% drops from peak to trough, plus a long list of scandals and shenanigans. Facebook just added to the feelings of disgust and revulsion people already felt toward the stock market.
Wednesday, May 30, 2012
New Long Trade USD/SEK
.png)
The price broke from a Fibonacci Funnel and (as is often the case) re-entered the funnel on a re-test. I've entered long on the second break. Stop is at red line and target is at the solid green line.
ABF:LSE Brief update
.png)
New short term trade - FTSE 100 short
.png)
The price has been trending down since 1st May and has formed a pattern within a pattern.
The first pattern is an inverted version of "Fibonacci Funnel" which is highlighted by the green lines. This is a bearish pattern. The second pattern is an ascending triangle (blue lines) which is normally a bullish pattern. However, it has just broken to the downside and I take that as being bearish too.
Furthermore, there is a bearish divergence (purple lines) which adds to my edge.
The price may retreat into the funnel or up to the lower trend line of the triangle for a re-test (which is a common occurrence) before continuing it's downward trend...........but then again it may not!
In any event, my protective stop and profit take orders are in place.
Tuesday, May 29, 2012
New Short Trade - ABF:LSE
.png)
.png)
The daily chart shows a bearish rising wedge formation and I've entered short just as the price re-tests the lower trend line. The price has just made it's first lower low after what can be described as a substantial uptrend spanning from August 2011 through to April 2012. I'm looking for a pull back.
My stop is just above the rising wedge upper trend line and for this to be hit, the price needs to make a new all time high. My first profit target will be at the 1:1 risk to reward ratio and I will monitor the price action as time progresses.
Valspar trade stopped out VAL:NYSE
.png)
Thursday, May 24, 2012
Facebook.....my prediction of 17th May proves to be spot on
My post dated 17th May suggesting that "Buyer beware" should be the position to take with regard to the Facebook IPO seems to have been spot on!
Look at the news today.....Mark Zuckerberg, Facebook, Morgan Stanley all being the subjected to lawsuits by disgruntled shareholders.
Morgan Stanley are already reported to be reviewing orders placed by its retail brokerage clients for shares of Facebook on a trade-by-trade basis and will make price adjustments if those clients paid too much for the stock, according to people familiar with the situation.
Talk about a farce????.........the retail investor gets a caning once again!
Where do we go from here?

That's the question which is always perplexing a Trader's mind. The Dow Jones Industrial Average has been in free-fall for the past 14 trading days.....and given that the price is still above the 200 day simple moving average, this type of decline has only happened two other times in the last 100 years.........
That means that most of us have NEVER experienced such market conditions in our lifetime.
In my opinion, the fact that the Dow can experience such a historical decline and still be above the 200 day SMA, simply proves how over bought the market was.
Friday, May 18, 2012
VAL:NYSE Update
.png)
AUD/JPY hits profit target
.jpg)
My first entry was very poor judgement on my behalf and that hurts. However, I am pleased with my actions in having the confidence to re-enter into the trade as the pattern was still valid. That proved to be a good decision and enabled me to turn a loss into a profit, without chasing the trade unnecessarily.
Of course, I am also aware that my earlier error means that my final profit was only half the size it would have been if I had acted according to my trading plan in the first place.
As I said earlier......LEARN and move on and be thankful that I had the confidence to re-enter the trade.
Thursday, May 17, 2012
New Trade- AUD/JPY
.jpg)
I am in a new short trade on the AUD/JPY currency pair, which has formed a volatility funnel.
I saw the pattern soon after it completed and took a late entry. HOWEVER, instead of placing my stop at the level dictated by the pattern (the red bar across the top of the chart,) I decided to place it at the bottom of the pattern (the short light red bar)........WRONG DECISION!
Why was it the wrong decision:-
1). The pattern dictates where my stop should go
2). My trading plan calls for me to place my stop where the pattern dictates.
3). If I wasn't happy to place my stop where the pattern dictates, I should not have taken the trade.
4). I entered the trade using a market order. I should have used a sell limit order to enter me at what was the second chance level.
I was stopped out for a loss. However, as the original pattern was still valid and the price level at which I was stopped out would have been the original entry price, I took a "second chance entry", which is circled red on the chart. Needless to say my stop on this trade is where it should be....at the top red bar!
Learn and move on!
The subsequent price action has been frustrating and the price has hit the blue support line four times in the past three days, without breaking through it. I may., therefore take my profit if the price touches that line again, depending on the price action and indicators, as it approaches.
VAL:NYSE Update
.png)
Facebook - Buyer Beware?

Those who invested in Blackstone way back then and held on are still losing money today!
BUYER BEWARE is my opinion!
Wednesday, May 16, 2012

The above is a cartoon which appeared in The Economist, that neatly sums up the implications of the Socialist win in the French presidential elections. German chancellor, Angela Merkel, is meeting French president, François Hollande, for dinner at Das Austerity Euro-Café. Austerity preaching Merkel is having a miniscule single sausage for dinner, while Hollande is enjoying a sumptuous repast and obviously ordering the most expensive wine from the list.
The cartoon would be funnier if it weren’t so true. Austerity is now suffering a retreat on the order of Napoleon’s retreat from Russia in the winter of 1815. Her Christian Democratic Union party suffered its worst post WWII defeat in last weekend’s North Rhine-Westphalia elections. It is now looking like Germany will have to accept a higher inflation rate as the price for bailing out Europe, something it is loath to do. Needless to say, this is terrible news for the Euro
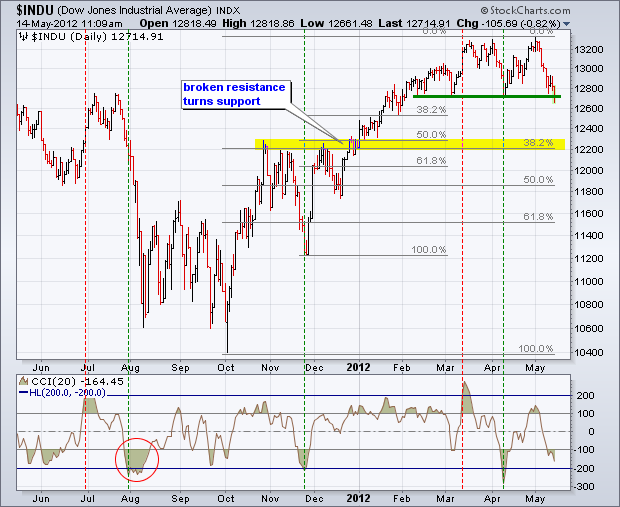
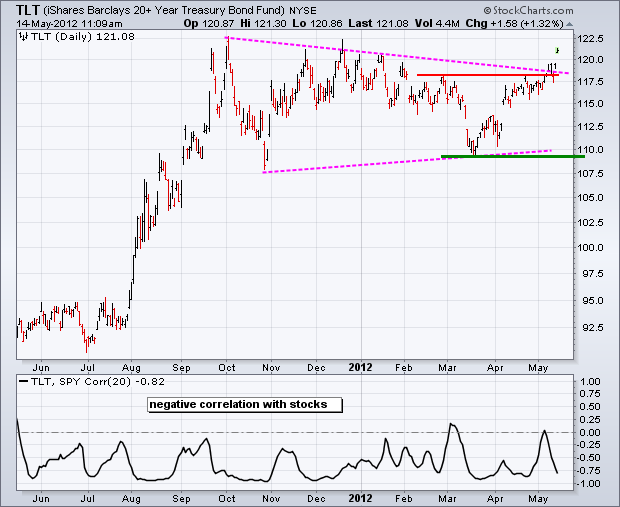
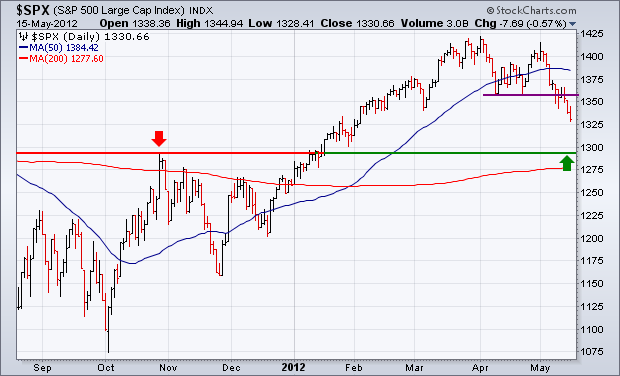
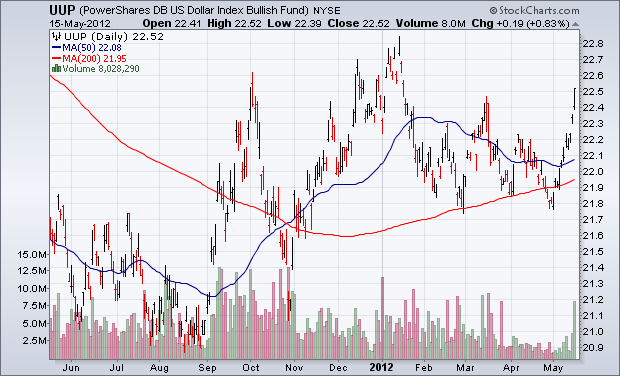
Charts Are Breaking Down All Over
Charts Are Breaking Down All Over.
They say a picture is
worth a 1,000 words, so here are 4,000 words worth. The good people at www.stockcharts.com put together this
series of charts establishing beyond any reasonable doubt that the “RISK ON”
trade is breaking down across all asset classes.
Everything is breaking
down, simultaneously and in unison, including the S&P 500 (SPX), Gold
(GLD), Silver (SLV), Oil (USO), Copper (CU), the Euro (FXE), the Australian
dollar (FXA), and the Canadian dollar (FXC). In the meantime, Treasury bonds
(TLT), (TBT) are moving from strength to strength.
The news from Europe can
only get worse. An American recession, considered impossible by strategists
only a month ago, is now looming large as their economic data continues to
deteriorate. The flight to safety has exploded into a stampede, driving the US
dollar index up 12 consecutive days, a new record.
If these charts continue
to break down, as the news flow dictates they should, here are some downside targets which could be met pretty rapidly:
(SPX) 1,280
($INDU) 12,200
(IWM) $70
(FXE) $126
(FXA) $95
(GLD) $150
(SLV) $25
(USO) $32
(CU) $22
VAL:NYSE Update

Monday, May 14, 2012
VAL:NYSE - Update
.jpg)
Subscribe to:
Posts (Atom)