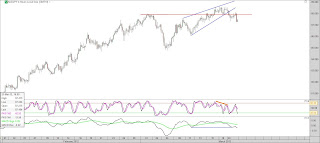
My AUD/JPY short trade has hit my profit target and is now closed. Whilst I am happy to have made an overall profit from this trade, I have mixed emotions about how I handled the trade.
My first entry was very poor judgement on my behalf and that hurts. However, I am pleased with my actions in having the confidence to re-enter into the trade as the pattern was still valid. That proved to be a good decision and enabled me to turn a loss into a profit, without chasing the trade unnecessarily.
Of course, I am also aware that my earlier error means that my final profit was only half the size it would have been if I had acted according to my trading plan in the first place.
As I said earlier......LEARN and move on and be thankful that I had the confidence to re-enter the trade.
Showing posts with label Forex. Show all posts
Showing posts with label Forex. Show all posts
Friday, May 18, 2012
Thursday, May 17, 2012
New Trade- AUD/JPY
I am in a new short trade on the AUD/JPY currency pair, which has formed a volatility funnel.
I saw the pattern soon after it completed and took a late entry. HOWEVER, instead of placing my stop at the level dictated by the pattern (the red bar across the top of the chart,) I decided to place it at the bottom of the pattern (the short light red bar)........WRONG DECISION!
Why was it the wrong decision:-
1). The pattern dictates where my stop should go
2). My trading plan calls for me to place my stop where the pattern dictates.
3). If I wasn't happy to place my stop where the pattern dictates, I should not have taken the trade.
4). I entered the trade using a market order. I should have used a sell limit order to enter me at what was the second chance level.
I was stopped out for a loss. However, as the original pattern was still valid and the price level at which I was stopped out would have been the original entry price, I took a "second chance entry", which is circled red on the chart. Needless to say my stop on this trade is where it should be....at the top red bar!
Learn and move on!
The subsequent price action has been frustrating and the price has hit the blue support line four times in the past three days, without breaking through it. I may., therefore take my profit if the price touches that line again, depending on the price action and indicators, as it approaches.
Wednesday, March 21, 2012
EUR/JPY Stopped out
My EUR/JPY short trade has just met its target BUT...not before stopping me out this morning!...
This is one of the hazards of trading. This is an instance where the AB=CD and the Fibonacci level didn't turn out well for me. Subsequent to being stopped out, the price has met all 3 of my profit targets so I will take the positives pout of this and move on.
This is one of the hazards of trading. This is an instance where the AB=CD and the Fibonacci level didn't turn out well for me. Subsequent to being stopped out, the price has met all 3 of my profit targets so I will take the positives pout of this and move on.
Tuesday, March 20, 2012
EUR/JPY Short Trade
I am short the EUR/JPY. The set up is on the hourly chart and is an AB=CD within a channel.
I entered at the "D" point which is just inside the channel. The purple boxes on the indicators show a divergence between the indicators and price. I have placed my stop further outside the channel so it is above the 1.272 Fibonacci extension which I hope will give me some extra protection if the price spikes through the channel. This means I simply reduce my trade size so that my £ risk is within my money management strategy.
I entered at the "D" point which is just inside the channel. The purple boxes on the indicators show a divergence between the indicators and price. I have placed my stop further outside the channel so it is above the 1.272 Fibonacci extension which I hope will give me some extra protection if the price spikes through the channel. This means I simply reduce my trade size so that my £ risk is within my money management strategy.
AUD/JPY - Short trade
I've entered a new short trade on ADU/JPY this morning. There is divergence between price and indicator on the daily chart and I've taken my entry set up on the 4H chart which has just broken down through a rising wedge. I've entered on a retest of the underside of the wedge.
The 4H chart shows macd not supporting the price rise and the price action is showing a rounded top formation. One area of concern is the previous resistance level just below my entry which may become support. This may prove that I should have waited to enter below this level...I will have to wait and see. My stop order and first target limit order are in place in accordance with my money management strategy.
Subscribe to:
Posts (Atom)
.jpg)
.jpg)


