
Friday, March 30, 2012
Update: ARM:LSE
Friday, March 23, 2012
New short trade ARM:LSE


The 4 hour chart is showing that the price has respected the Fibonacci .618 retracement of the most recent swing and my momentum indicator is rolling over.
The hourly chart shows a clear rising wedge and I have entered at the bottom of the wedge, at the first re-test of the trend line after the price broke through. My macd indicator is showing a bearish divergence with price.
My stop is just outside the top of the wedge and I've placed my first target limit order.
Thursday, March 22, 2012
CHF/HUF targets met
.jpg)
My CHF/HUF long trade has met all 3 profit targets and is now closed for a net RRR of 1: 1.75.
This is a nice example of a falling wedge working out well.
Wednesday, March 21, 2012
EUR/JPY Stopped out
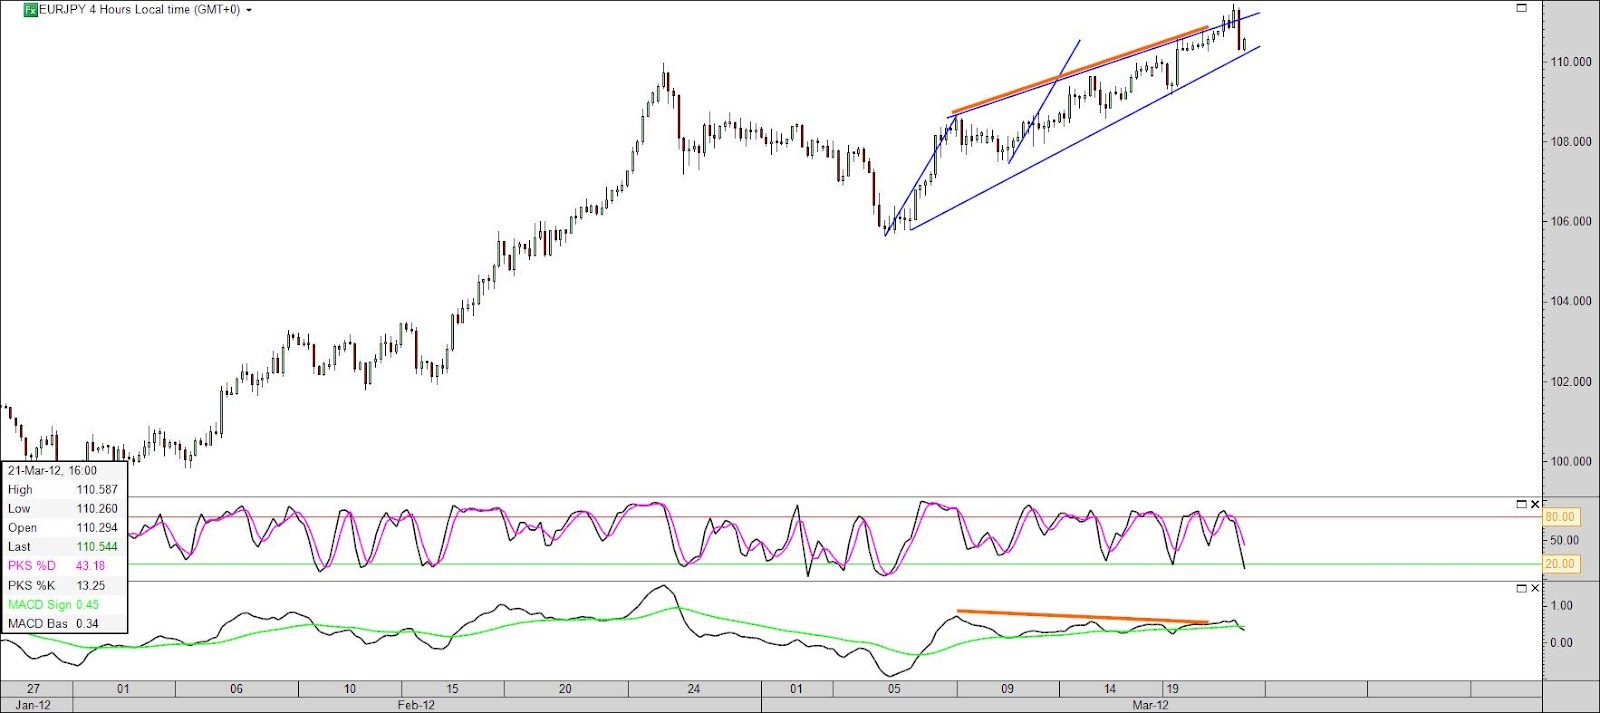
This is one of the hazards of trading. This is an instance where the AB=CD and the Fibonacci level didn't turn out well for me. Subsequent to being stopped out, the price has met all 3 of my profit targets so I will take the positives pout of this and move on.
CHF/HUF Update
.jpg)
My CHF/HUF trade has broken out of the falling wedge and made good progress. It didn't quite make the first target but got 75% of the way to it. In these instances, I move my stop to break even so that I don't endure the pain of seeing a profit turn into a loss if the trade doesn't make further upward progress. I am therefore in a risk free trade from here on.
AUD/JPY - Targets met

Amlin - Targets met
.jpg)
My short term trade on AML:LSE has met it's first and second target and is now closed. RRR = 1.5:1
Tuesday, March 20, 2012
EUR/JPY Short Trade

I entered at the "D" point which is just inside the channel. The purple boxes on the indicators show a divergence between the indicators and price. I have placed my stop further outside the channel so it is above the 1.272 Fibonacci extension which I hope will give me some extra protection if the price spikes through the channel. This means I simply reduce my trade size so that my £ risk is within my money management strategy.
CHF/HUF Long Trade

AUD/JPY - Short trade


The 4H chart shows macd not supporting the price rise and the price action is showing a rounded top formation. One area of concern is the previous resistance level just below my entry which may become support. This may prove that I should have waited to enter below this level...I will have to wait and see. My stop order and first target limit order are in place in accordance with my money management strategy.
Amlin - short trade update
.jpg)
Friday, March 16, 2012
Closed short trade for a quick 5.5% profit

It's Friday afternoon...I've made 5.5% profit in 24 hours and don't want to leave that exposed to the vagaries of the market on Monday morning so on the basis that a profit isn't a profit until it's in your account....I've taken the money and run!. My net RRR was a respectable 2:1.
Short Trade - Amlin PLC


I have now gone short on Amlin PLC (AML:LSE). I am taking the trade based upon the daily chart but with my entry and stop being based on the hourly chart. The daily chart has been trading in a channel since October 2011 and this was broken to the downside on 5th March. However, the price has now retraced to re-test the lower channel line. There is also a channel on the 1 hourly chart and the price is within a few pips of the top of this channel. Note that there is a bearish divergence on my MACD indicator (orange lines) where the indicator is making a lower low and the price is making a higher high. I am placing a very tight stop on this trade and that may stand me in good stead for a high RRR trade.
Market geometry at work

Thursday, March 15, 2012
A new short term, short trade

Today, I have gone short of Rockhopper Exploration RKH:LSE, for what I hope will be a quick in and out trade. The price has already hit my first target at 351 for a RRR of 1:1.
So....why short a share that has had such a strong move up? The share has had a good run recently but appears to be stalling at the Fibonacci .618 level of a much larger swing on the weekly chart.
The price action appears to be forming a descending triangle pattern and the price has rejected the top side four times now. (It could also be creating a symmetrical triangle which could be a continuation pattern and would not be good for my trade). There have been two strong, above average volume days in March and they have both been down days. I take this as a bearish implication. In cases like this I like to enter as near to the top of the traingle as possible. In this case, if the trade is favourable, I can be out with a 2:1 RRR before the price hits the bottom of the triangle, which I suspect will be an area of strong resistance. (It could also be the neckline of a head and shoulders pattern...but that's another story!) Furthermore...there is divergence between price and momentum on MACD . There is also a potential AB=CD pattern completing at the .618 retracement of the previous swing. This is well below my target and I will monitor price action as the trade proceeds. In any event, I have applied my money management strategy and the trade will play itself out.
AUUCAD Stopped out with a profit
The remaining part of my AUD/CAD short trade was stopped out overnight with with a small profit. This gives me a total RRR of 2.1 t0 1, which is very acceptable. My trailing stop was intentionally tight as 10 of the last 12 days were "down days" and a bounce can therefore be expected.
Wednesday, March 14, 2012
AUD/CAD Update
.jpg)
I will continue to monitor the price action and act accordingly but I am now running a 40 pip trailing stop and hope that will enable me to ride the trade all the way down towards the bottom of the weekly wedge.
Tuesday, March 13, 2012
AUD/CAD Short Trade
.jpg)
.jpg)
Entry was at the break of the daily wedge and my first target will be RRR 1:1. If that is reached I shall hold the remainder of the position hoping for it to reach the bottom of the weekly wedge. The price action today may be showing that the retest of the lower wedge line has taken place and if so, I would expect further price deterioration from here.
Thursday, March 08, 2012
EUR/USD Update

I implemented my "indicator trailing stop strategy" and closed this trade late last night for 1 pip profit! ( after coming home from the West Ham v Watford game).
You can see the magenta coloured lines on price and on the macd. This was indicating a bullish divergence between the indicator and price and whilst I love divergence in the direction of the my trade, I hate it when it is against the direction of my trade. So for those are are avid trend traders....there was a trade which was in the same direction as the weekly, daily and hourly trend and it failed.......that's the market for you!
Wednesday, March 07, 2012
Geometry in the Market - Amazon weekly chart

This is a good example of geometry working in the market...in particular....the AB=CD pattern giving projected levels for a potential reversal of price.
You can see that the orange AB leg formed between October 2008 and April 2010. The price then retraced until July 2010, before continuing its upward path. At this point, the CD leg can be projected to create an "area of interest", in both price and time.
The blue AB leg formed between between June 2010 and Feb 2011 then retraced. Therefore in Feb2010, it was possible to make a second projection which created a second "area of interest" in price and time.
Obviously, these areas of interest are not places to go blindly short but they create a zone where, if you are long, you might want to tighten up your stops and if you are short, you may.
Some traders would use either of the "C" points to look to enter long on the assumption that the trend is continuing.
Note how the price turned exactly at the blue "D"
A new short position on Playtech

I placed a buy a sell stop order on PTEC:LSE and have been filled at 303p. This is a simple triangle trade which sometimes indicates a continuation of the previous trend. However, in this instance, the price was struggling to make a clean break through the .618 level and there was divergence on the macd and convergence on the stochastic. Importantly, the weekly chart has been in a down trend since March 2010. This morning, the price has already re-tested the lower line of the triangle (which often happens) and appears to have been rejected ...but I will have to wait and see how this plays out
EUR/USD
I've taken a short position on the EUR/USD this morning. The daily chart has been in a clear downtrend since Aug 2011 so I am interested i short positions on the shorter time frame charts. The 1 hour chart shows a very clear down trend since 29th February and with the price action sitting at the top of the channel, I am able to enter a short position with my stop VERY close to my entry position. That offers me a large potential RRR (reward to risk ratio). My first target will be the middle channel line (which coincides with the Fibonacci level .786 of the previous upswing) and my second at the bottom channel line. You may note that there is divergence between the price and stochastic indicator - you can see a "step" on the and I like trading these as I believe they show a change in momentum of the participants. I also prefer to see divergence on the macd indicator ...but you can't have everything!


S&P Finally retraces

Saturday, March 03, 2012
Vodafone : - VOD:LSE
I took a long position in Vodafone on Friday. Vodafone has been creating a volatility funnel since Sept 2007 and there is another volatility funnel forming on the daily chart. This is the pattern I am trading. However, instead of taking a traditional breakout entry at the top of the spout part of the funnel, I have taken an entry at what I hope is the bottom on the spout. This, of course, is a higher risk entry but it also increases the reward to risk ratio dramatically if it works out. My risk is 6% of the entry price or 10p per share.
When I take this lower entry, I always place my stop just below the bottom of the previous swing low, in case the funnel spout has not actually formed yet and my entry was premature. At the bottom of the previous swing low I would want to be out of the trade in any event.
I am encouraged to take this trade by the following:-
1). Volatility funnel on weekly chart with the smaller volatility funnel on the daily chart.
2). There is a bullish divergence between my stochastic indicator and the price.(red line) and a second converging cross of the oversold line
3). There is a bullish divergence between my macd indicator and the price. (red line)
4). The 200 ma has been moving slightly upwards since 7th Feb, appears to be supporting the price and is sitting in between the .618 and .786 fib ratios.
5). A candlestick tweezer bottom was made on the previous two days and the price has rejected that same level again.
+1.jpg)
EUR/CHF Update (4)
I was stopped out at break even on this trade. I don't like to stay in breakout trades for so long as I did in this one.....but, as I said previously, with the stop at break even...it's a free trade.
BT Broadband
I've been without my broadband service from BT since Tuesday. It was restored today (midday Saturday).
Unfortunately, I have to report that the customer service I received from BT (and in particular their off-shore call centre) and only be described as atrocious!...
I will be moving my broadband account this week as I have no desire to deal with a Company who appear to have little or no regard for their customers........lots of hollow sound bites......and that's about it. Given time, they can only hang themselves and end up with no customers other than those that have no choice but to deal with them.
I called up their chart this morning and was staggered to see how much progress their share price has made since February 2009....I've set an alert close to the 0.618 Fibonacci level (230p)and if it gets to that level...I'll be shorting it very aggressively.

Subscribe to:
Posts (Atom)