
Showing posts with label General comments. Show all posts
Showing posts with label General comments. Show all posts
Monday, June 18, 2012
FTSE Short Trade Target met!
.png)
50 pips in 48 minutes!
Markets celebrate!...Hello?..I'm short the FTSE

So this morning the market is celebrating the fact that Greece is not going to go bust this week! The result
At one point the FTSE 100 was up around 10%.
I've gone short the index simply because nothing has changed soince Friday....OK...the Greek vote went the way the world politicians wanted.....but..hey ho...what do that do for the UK economy!....ZILCH!
The result of the Greek election gives the pro-austerity conservative and socialist parties enough votes to form a fragile and awkward ruling coalition!
Oh and by the way......also at the weekend elections the French Socialist party won a commanding parliamentary majority, giving President Hollande the power to tax and spend to his heart's desire.........
Wednesday, June 13, 2012
Why it pays to be a swing trader.....not a position investor
I always approach my trading as a swing trader; not a position investor. For me, preservation of capital rules above all else.
To illustrate the dangers of position (long-term buy-and-hold) investing, I read today that Anthony Bolton, the famed Fidelity fund manager, has managed to lose over 24% in his China fund in the past year.
I don’t know about you, but this type of investing just doesn’t appeal to me. It is all very well saying – or more honestly, praying – that it will do well in the future. But that smacks of rationalisation to save face.
In truth, no-one knows what a fund – or any financial market – will do in the future with anything approaching certainty. It could go down 50% or more. It could double.
My point is that a loss is a loss, and any investor who puts their faith – and it is faith – in a star manager, is in a state of denial when faced with this reality.
The pain in Spain.....and Greece...and Italy...and Portugal...and...
Whilst I am the first to acknowledge that, as a trader, I must accept that the market is always right, there are times when I can't help wondering if the rest of the world is seeing something that I am not not!
There is so much financial trouble in the Eurozone...and in the USA...that to me, it is almost inconceivable that the markets can rise and take out previous highs.....but the bulls are still in there, fighting hard and it's a case of "wait and see" who wins the battle.
I, for one, will not be joining the bullish camp until my charts, patterns and indicators tell me to do so....until then..I'm staying on the short side.
Back from my European Tour
.png)
.png)
.png)
2,200 miles and 9 countries in 9 days!
If you are into motorbiking, the Alps are a fantastic place to ride!
Thursday, May 31, 2012
No updates for a few days.......European Motorcycle Tour
.png)
.png)
It normally rains when we are away...but the roads are great for biking and the scenery is fantastic, so getting wet is a price well worth paying.
If you're a trader..I wish you good trading!
Facebook : My final thoughts
Since there is more interesting things to concern myself with as a Trader, I'd just like to add the following:
Facebook’s stock is down 29% since
it opened at $42.05 per share on May 18. This grim result is causing a lot of
howling about the IPO process and those “damn Wall Street banks.
Of course, you could take the view that investors who fool around with hyped
IPOs get what they deserve. My sympathies lean in that direction. If you play
with fire, you might get burned.
Regardless, I agree with this comment in
yesterday’s Wall Street
Journal:
|
What could have been a model example
of the market’s strengths — an eight-year-old company with 900 million users
raising billions of dollars from a cross-section of the investing public —
ended up as a case study of the power wielded by insiders over outsiders.
|
In short, Facebook is another black eye for a market that already has a lot of black eyes. In the last dozen years, we've suffered through two 50% drops from peak to trough, plus a long list of scandals and shenanigans. Facebook just added to the feelings of disgust and revulsion people already felt toward the stock market.
Thursday, May 24, 2012
Facebook.....my prediction of 17th May proves to be spot on
My post dated 17th May suggesting that "Buyer beware" should be the position to take with regard to the Facebook IPO seems to have been spot on!
Look at the news today.....Mark Zuckerberg, Facebook, Morgan Stanley all being the subjected to lawsuits by disgruntled shareholders.
Morgan Stanley are already reported to be reviewing orders placed by its retail brokerage clients for shares of Facebook on a trade-by-trade basis and will make price adjustments if those clients paid too much for the stock, according to people familiar with the situation.
Talk about a farce????.........the retail investor gets a caning once again!
Where do we go from here?

That's the question which is always perplexing a Trader's mind. The Dow Jones Industrial Average has been in free-fall for the past 14 trading days.....and given that the price is still above the 200 day simple moving average, this type of decline has only happened two other times in the last 100 years.........
That means that most of us have NEVER experienced such market conditions in our lifetime.
In my opinion, the fact that the Dow can experience such a historical decline and still be above the 200 day SMA, simply proves how over bought the market was.
Thursday, May 17, 2012
Facebook - Buyer Beware?

Those who invested in Blackstone way back then and held on are still losing money today!
BUYER BEWARE is my opinion!
Wednesday, May 16, 2012
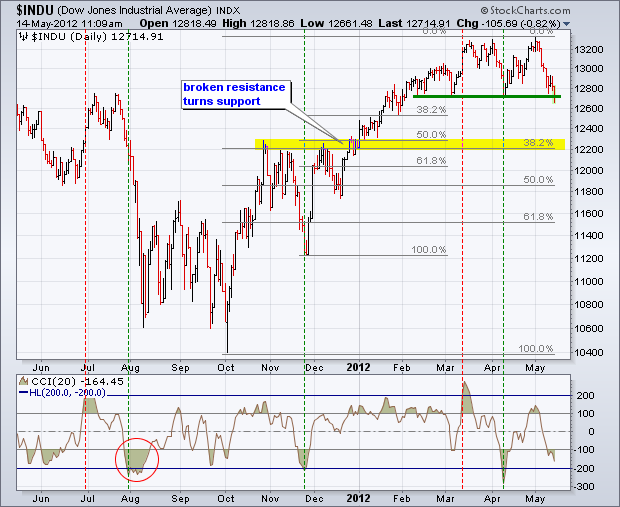
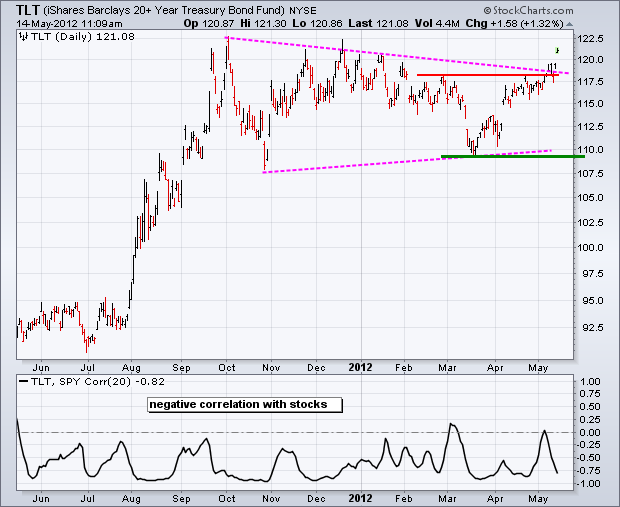
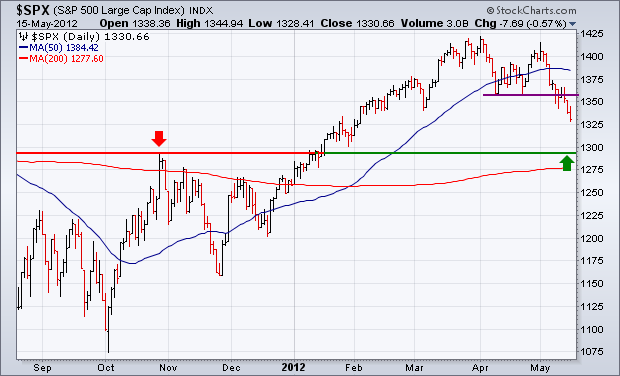
Charts Are Breaking Down All Over
Charts Are Breaking Down All Over.
They say a picture is
worth a 1,000 words, so here are 4,000 words worth. The good people at www.stockcharts.com put together this
series of charts establishing beyond any reasonable doubt that the “RISK ON”
trade is breaking down across all asset classes.
Everything is breaking
down, simultaneously and in unison, including the S&P 500 (SPX), Gold
(GLD), Silver (SLV), Oil (USO), Copper (CU), the Euro (FXE), the Australian
dollar (FXA), and the Canadian dollar (FXC). In the meantime, Treasury bonds
(TLT), (TBT) are moving from strength to strength.
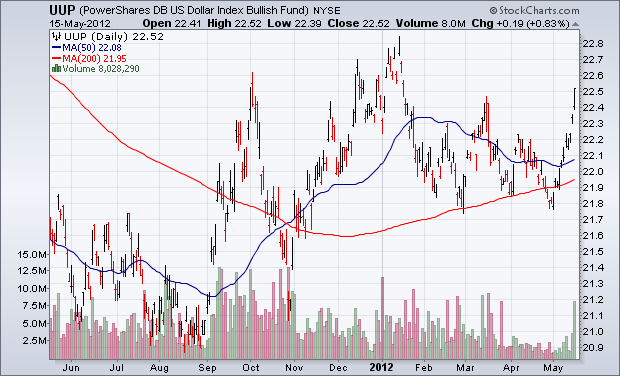
The news from Europe can
only get worse. An American recession, considered impossible by strategists
only a month ago, is now looming large as their economic data continues to
deteriorate. The flight to safety has exploded into a stampede, driving the US
dollar index up 12 consecutive days, a new record.
If these charts continue
to break down, as the news flow dictates they should, here are some downside targets which could be met pretty rapidly:
(SPX) 1,280
($INDU) 12,200
(IWM) $70
(FXE) $126
(FXA) $95
(GLD) $150
(SLV) $25
(USO) $32
(CU) $22
Saturday, May 12, 2012
My goal of trading well......
Traders who routinely make enormous amounts of money trading don’t mentally count the pounds or dollars while they’re trading. They don’t keep a mental calculator continuously running in their head to constantly keep track of how much money they’ve put into their account.
“Let’s see, I bought 1000 shares of Vodafone and it’s up one point, times one Pound or dollar a share, equals 1000 pounds or dollars!”
Nothing and I mean nothing, will blow your concentration and cloud your judgment faster than keeping that calculator running in your head, calculating the pounds or dollars you’ve made or lost each minute that goes by during the trading day.
Another booby trap is to announce to the world, your husband, wife or even your dog that you’re going to make a specific amount of money trading today. You’re setting yourself up for failure. Setting as specific dollar amount you must bring home each day, especially if you’re a beginning trader, assures that it probably won’t happen. This need to make a specific amount of money colours your view of the market and pressures you to open positions that are marginal trades because you have promised yourself or worse yet, someone else - that you’re going to bring home the cash! Your pledge echoes in your mind, so you force trades. Odds are, you lose money. Now you’re embarrassed with yourself and you start questioning your self-esteem, which automatically leads to more losses.
The cure for this illness: From this point forward, your goal is not to make money. Your goal is to trade to trade well! Money is a by-product of trading well. A very interesting thing starts to happen when you focus on trading well. Your profits will start to add up a lot faster than they did when making money was your primary goal. This is simply because traders who focus on trading well cut their losses and let their winners run. They protect their capital and leave unnecessary risks to others. They recognize a choppy market and sit on their hands and don’t trade. They make promises to no one, including themselves, about the money they want to take home.
Traders who trade well let the market come to them. They are extremely patient and disciplined. They wait for the perfect setup and entry point. If that perfect point doesn’t come along, oh well, they wait for the next one knowing that another chance is just around the corner. Once in the trade, they mechanically and methodically manage their position, taking profits at specific points, and moving their stop loss to protect their principal.
Traders who trade well don’t trade simply for the excitement of the trade because they have become addicted to the thrill. They don’t trade out of boredom or when they are sick or tired. They don’t trade especially if they have stress in their life that disallows their full focus on the market. Successful traders always abide by their trading rules and never stray from them. Traders who trade well are perfectionists and can make themselves very wealthy as a result of their unwavering discipline.
That is my goal!
Tuesday, April 24, 2012
Travelling in the USA

Wednesday, April 11, 2012
Why you should look after your own investments!
I frequent a website at http://www.cxoadvisory.com/. This table caught my eye. It is a list of performance statistics for "Professional investors".
Here is the latest table:-

I've highlighted in green those results that were better than 50%, which, statistically, you should be able to achieve on the toss of a coin! Notice that only the top four, led by Ken Fisher and David Dreman, can outperform a coin toss, and then, only just. Media star and permabull, Abbey Joseph Cohen of Goldman Sachs (GS), is down in the dumps with a 35% success rate. Note also that the bottom position is held by Elliot Wave guru, Robert Prector, who is right a dismal 23% of the time.
Tuesday, April 10, 2012
Update - Sell in May and go away
I've closed my Put option trades in the following companies today. Every one was a winning trade. Thanks Mr. Market!
The trades were all listed in my post entitled Sell in May and Go Away on 3rd April.
The positions were all entered on 3rd April , were all as a result of established patterns and were in the following companies:-
ORLY, FFIV, PCP, PXD, SPG, BSFT, PII, VFC, CMI, IBM, NTAP, GS,GWW ( all US stocks)
The trades were all listed in my post entitled Sell in May and Go Away on 3rd April.
The positions were all entered on 3rd April , were all as a result of established patterns and were in the following companies:-
ORLY, FFIV, PCP, PXD, SPG, BSFT, PII, VFC, CMI, IBM, NTAP, GS,GWW ( all US stocks)
Tuesday, April 03, 2012
Sell in May and Go Away

Whilst the market is undeniably bullish at the present time, most indicators are showing bearish divergence so I'm betting that the bulls' days are numbered. The market has had a parabolic rise and whilst I expect any retrace to be short lived, I also expect it to be steep.......
Personally, I am more comfortable being short than long so I am taking a good few short term, short positions on the US market by buying Put Options with the May 18th. expiry date.
I have taken 13 positions in all and all are within my money management criteria.
The positions are all as a result of established patterns and are in the following companies:-
ORLY, FFIV, PCP, PXD, SPG, BSFT, PII, VFC, CMI, IBM, NTAP, GS,GWW
My strategy with option plays is to risk the total amount that I am prepared to lose and take profits at 100% return on risk. In this instance if 50% of my trade are winners and 50% losers, I will break even. However, If my win/loss ratio is greater than 50% I shall make a profit. Of course, If my win/loss ratio is less than 50%, I shall make a loss.
That's trading!
Wednesday, March 07, 2012
S&P Finally retraces

Saturday, March 03, 2012
BT Broadband
I've been without my broadband service from BT since Tuesday. It was restored today (midday Saturday).
Unfortunately, I have to report that the customer service I received from BT (and in particular their off-shore call centre) and only be described as atrocious!...
I will be moving my broadband account this week as I have no desire to deal with a Company who appear to have little or no regard for their customers........lots of hollow sound bites......and that's about it. Given time, they can only hang themselves and end up with no customers other than those that have no choice but to deal with them.
I called up their chart this morning and was staggered to see how much progress their share price has made since February 2009....I've set an alert close to the 0.618 Fibonacci level (230p)and if it gets to that level...I'll be shorting it very aggressively.

Thursday, February 23, 2012
I make extensive use of Fibonacci numbers and ratio's in my trading endeavours. I was mentored by Larry Pesavento (of Gartley & Butterfly patterns fame) and his colleague, Costas Vayonis.

(Answer: Imagine that there are xn pairs of rabbits after n months. The number of pairs in month n+1 will be xn (in this problem, rabbits never die) plus the number of new pairs born. But new pairs are only born to pairs at least 1 month old, so there will be xn-1 new pairs: xn+1 = xn + xn-1
Which is simply the rule for generating the Fibonacci numbers.)

Leonardo Da Pisa Fibonacci
Have you ever wondered where we got our decimal numbering system from? The Roman Empire left Europe with the Roman numeral system which we still see, amongst other places, in the copyright notices after TV programmes (1997 is MCMXCVII).
The Roman numerals were not displaced until the 13th Century AD when Fibonacci published his Liber abaci which means "The Book of Calculations".
Leonardo Fibonacci c1175-1250.
Fibonacci, or more correctly Leonardo da Pisa, was born in Pisa in 1175AD. He was the son of a Pisan merchant who also served as a customs officer in North Africa. He travelled widely in Barbary (Algeria) and was later sent on business trips to Egypt, Syria, Greece, Sicily and Provence.
In 1200 he returned to Pisa and used the knowledge he had gained on his travels to write Liber abaci in which he introduced the Latin-speaking world to the decimal number system. The first chapter of Part 1 begins:
These are the nine figures of the Indians: 9 8 7 6 5 4 3 2 1. With these nine figures, and with this sign 0 which in Arabic is called zephirum, any number can be written, as will be demonstrated.
Fibonacci sequence
Fibonacci is perhaps best known for a simple series of numbers, introduced in Liber abaci and later named the Fibonacci numbers in his honour.
The series begins with 0 and 1. After that, use the simple rule:
Add the last two numbers to get the next.
1, 2, 3, 5, 8, 13, 21, 34, 55, 89, 144, 233, 377, 610, 987,...
You might ask where this came from? In Fibonacci's day, mathematical competitions and challenges were common. For example, in 1225 Fibonacci took part in a tournament at Pisa ordered by the emperor himself, Frederick II.
It was in just this type of competition that the following problem arose:
(Answer: Imagine that there are xn pairs of rabbits after n months. The number of pairs in month n+1 will be xn (in this problem, rabbits never die) plus the number of new pairs born. But new pairs are only born to pairs at least 1 month old, so there will be xn-1 new pairs: xn+1 = xn + xn-1
Which is simply the rule for generating the Fibonacci numbers.)
The Golden Section
A special value, closely related to the Fibonacci series, is called the golden section. This value is obtained by taking the ratio of successive terms in the Fibonacci series:
Ratio of successive Fibonacci terms.
If you plot a graph of these values you'll see that they seem to be tending to a limit. This limit is actually the positive root of a quadratic equation (see box) and is called thegolden section, golden ratio or sometimes the golden mean.
The golden section is normally denoted by the Greek letter phi. In fact, the Greek mathematicians of Plato's time (400BC) recognized it as a significant value and Greek architects used the ratio 1:phi as an integral part of their designs, the most famous of which is the Parthenon in Athens.
The Parthenon in Athens.
Subscribe to:
Posts (Atom)