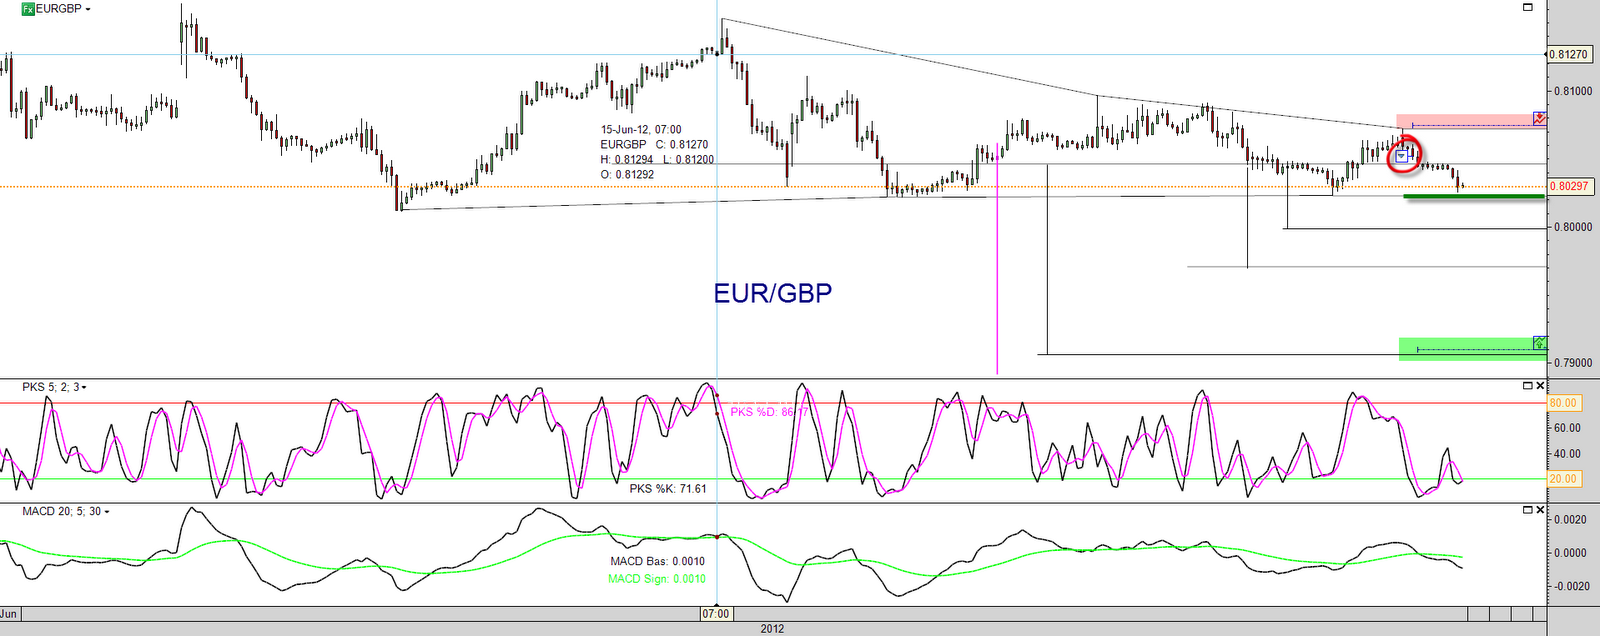
This Fibonacci funnel trade is making slow progress. It had a false breakout during the course of today, highlighted by the orange circle, and has re-entered the funnel.
However, my stop loss is in place as well as my profit target so I will let the trade run it's course, in accordance with my strategy and money management plan.
Showing posts with label Fibonacci Funnel. Show all posts
Monday, June 25, 2012
New Short Trade EUR/GBP
I took a new trade on the EUR/GBP pair shortly after the market opened last night(Sunday). The pattern is a volatility funnel.
The chart shows the funnel and the thin green line shows my traditional entry point.
However, I often take what I call an "early entry" trade and this I what I have done here. The entry was just after the price action appeared to have made a clear high to form the funnel. Obviously, this is a higher risk entry than waiting for the break (or a second chance entry), but it often works well and increases the R:RR dramatically as it means your stop (red highlight) is much closer to entry but the target (green highlight) is the same as if it were a traditional entry.
The chart shows the funnel and the thin green line shows my traditional entry point.
However, I often take what I call an "early entry" trade and this I what I have done here. The entry was just after the price action appeared to have made a clear high to form the funnel. Obviously, this is a higher risk entry than waiting for the break (or a second chance entry), but it often works well and increases the R:RR dramatically as it means your stop (red highlight) is much closer to entry but the target (green highlight) is the same as if it were a traditional entry.
Thursday, June 14, 2012
FTSE Short trade closed for a small profit
I had to leave my desk for a couple of hours this morning and as the price had fallen below the previous low (bottom mauve line), I moved my stop into the middle of the funnel which guaranteed me a small profit.
I was stopped out and, of course, the market has dropped a little further since then.
However, always keep in mind:-
Rule 1 of trading - Don't lose money
Rule 2 of trading - Don't lose money
Rule 3 of trading - Apply rules 1 & 2
And.....a profit is not a profit until it is banked!
I am watching for another entry at the top of the funnel if the opportunity arises.
I was stopped out and, of course, the market has dropped a little further since then.
However, always keep in mind:-
Rule 1 of trading - Don't lose money
Rule 2 of trading - Don't lose money
Rule 3 of trading - Apply rules 1 & 2
And.....a profit is not a profit until it is banked!
I am watching for another entry at the top of the funnel if the opportunity arises.
New short trade FTSE 100
I've spotted a potential Fibonacci funnel setting up on the FTSE100 cfd. I've taken an earlier entry than normal.
The benefit of this is that it reduces my risk by some 35 points....and of course, would increase my R:RR significantly if the trade is successful.
However, the downside is that by taking the entry early, I could be wrong in my view that this will be a Fibonacci funnel...only time will tell.
Thursday, May 31, 2012
USD/SEK closed for a profit
I've closed my long trade on USD/SEK for a profit....the price hadn't quite reached my target but I am going away tomorrow for a week and I wanted to tidy up my book. The trade achieved a R:RR 2:1 in 24 hours....very acceptable!
FTSE Short Trade closed for a profit
I have closed my FTSE short trade for a profit. It was a little frustrating as it made two attempts to break down big time...and failed. I had trailed my stop and was stopped out as you can see o the chart. However a R:RR o 1:1 in 24 hours is very acceptable!
Wednesday, May 30, 2012
New Long Trade USD/SEK
I've just taken a second chance entry on USD/SEK.
The price broke from a Fibonacci Funnel and (as is often the case) re-entered the funnel on a re-test. I've entered long on the second break. Stop is at red line and target is at the solid green line.
New short term trade - FTSE 100 short
I've taken a new short trade today on the hourly chart of the FTSE100 CFD.
The price has been trending down since 1st May and has formed a pattern within a pattern.
The first pattern is an inverted version of "Fibonacci Funnel" which is highlighted by the green lines. This is a bearish pattern. The second pattern is an ascending triangle (blue lines) which is normally a bullish pattern. However, it has just broken to the downside and I take that as being bearish too.
Furthermore, there is a bearish divergence (purple lines) which adds to my edge.
The price may retreat into the funnel or up to the lower trend line of the triangle for a re-test (which is a common occurrence) before continuing it's downward trend...........but then again it may not!
In any event, my protective stop and profit take orders are in place.
The price has been trending down since 1st May and has formed a pattern within a pattern.
The first pattern is an inverted version of "Fibonacci Funnel" which is highlighted by the green lines. This is a bearish pattern. The second pattern is an ascending triangle (blue lines) which is normally a bullish pattern. However, it has just broken to the downside and I take that as being bearish too.
Furthermore, there is a bearish divergence (purple lines) which adds to my edge.
The price may retreat into the funnel or up to the lower trend line of the triangle for a re-test (which is a common occurrence) before continuing it's downward trend...........but then again it may not!
In any event, my protective stop and profit take orders are in place.
Friday, May 18, 2012
AUD/JPY hits profit target
My AUD/JPY short trade has hit my profit target and is now closed. Whilst I am happy to have made an overall profit from this trade, I have mixed emotions about how I handled the trade.
My first entry was very poor judgement on my behalf and that hurts. However, I am pleased with my actions in having the confidence to re-enter into the trade as the pattern was still valid. That proved to be a good decision and enabled me to turn a loss into a profit, without chasing the trade unnecessarily.
Of course, I am also aware that my earlier error means that my final profit was only half the size it would have been if I had acted according to my trading plan in the first place.
As I said earlier......LEARN and move on and be thankful that I had the confidence to re-enter the trade.
My first entry was very poor judgement on my behalf and that hurts. However, I am pleased with my actions in having the confidence to re-enter into the trade as the pattern was still valid. That proved to be a good decision and enabled me to turn a loss into a profit, without chasing the trade unnecessarily.
Of course, I am also aware that my earlier error means that my final profit was only half the size it would have been if I had acted according to my trading plan in the first place.
As I said earlier......LEARN and move on and be thankful that I had the confidence to re-enter the trade.
Thursday, May 17, 2012
New Trade- AUD/JPY
I am in a new short trade on the AUD/JPY currency pair, which has formed a volatility funnel.
I saw the pattern soon after it completed and took a late entry. HOWEVER, instead of placing my stop at the level dictated by the pattern (the red bar across the top of the chart,) I decided to place it at the bottom of the pattern (the short light red bar)........WRONG DECISION!
Why was it the wrong decision:-
1). The pattern dictates where my stop should go
2). My trading plan calls for me to place my stop where the pattern dictates.
3). If I wasn't happy to place my stop where the pattern dictates, I should not have taken the trade.
4). I entered the trade using a market order. I should have used a sell limit order to enter me at what was the second chance level.
I was stopped out for a loss. However, as the original pattern was still valid and the price level at which I was stopped out would have been the original entry price, I took a "second chance entry", which is circled red on the chart. Needless to say my stop on this trade is where it should be....at the top red bar!
Learn and move on!
The subsequent price action has been frustrating and the price has hit the blue support line four times in the past three days, without breaking through it. I may., therefore take my profit if the price touches that line again, depending on the price action and indicators, as it approaches.
Wednesday, April 04, 2012
Update VOD:LSE
I think the market correction may be under way after the Federal Reserve indicated yesterday that there may not be any further quantative easing. My Vodafone position is showing a profit of about 4% in 4 weeks so I've closed that position this morning. Given my overall bearishness, I don't want to see that (small) profit turn into a loss....and nobody ever went broke taking a profit off the table!
Saturday, March 03, 2012
Vodafone : - VOD:LSE
I took a long position in Vodafone on Friday. Vodafone has been creating a volatility funnel since Sept 2007 and there is another volatility funnel forming on the daily chart. This is the pattern I am trading. However, instead of taking a traditional breakout entry at the top of the spout part of the funnel, I have taken an entry at what I hope is the bottom on the spout. This, of course, is a higher risk entry but it also increases the reward to risk ratio dramatically if it works out. My risk is 6% of the entry price or 10p per share.
When I take this lower entry, I always place my stop just below the bottom of the previous swing low, in case the funnel spout has not actually formed yet and my entry was premature. At the bottom of the previous swing low I would want to be out of the trade in any event.
I am encouraged to take this trade by the following:-
1). Volatility funnel on weekly chart with the smaller volatility funnel on the daily chart.
2). There is a bullish divergence between my stochastic indicator and the price.(red line) and a second converging cross of the oversold line
3). There is a bullish divergence between my macd indicator and the price. (red line)
4). The 200 ma has been moving slightly upwards since 7th Feb, appears to be supporting the price and is sitting in between the .618 and .786 fib ratios.
5). A candlestick tweezer bottom was made on the previous two days and the price has rejected that same level again.
When I take this lower entry, I always place my stop just below the bottom of the previous swing low, in case the funnel spout has not actually formed yet and my entry was premature. At the bottom of the previous swing low I would want to be out of the trade in any event.
I am encouraged to take this trade by the following:-
1). Volatility funnel on weekly chart with the smaller volatility funnel on the daily chart.
2). There is a bullish divergence between my stochastic indicator and the price.(red line) and a second converging cross of the oversold line
3). There is a bullish divergence between my macd indicator and the price. (red line)
4). The 200 ma has been moving slightly upwards since 7th Feb, appears to be supporting the price and is sitting in between the .618 and .786 fib ratios.
5). A candlestick tweezer bottom was made on the previous two days and the price has rejected that same level again.
EUR/CHF Update (4)
I was stopped out at break even on this trade. I don't like to stay in breakout trades for so long as I did in this one.....but, as I said previously, with the stop at break even...it's a free trade.
BT Broadband
I've been without my broadband service from BT since Tuesday. It was restored today (midday Saturday).
Unfortunately, I have to report that the customer service I received from BT (and in particular their off-shore call centre) and only be described as atrocious!...
I will be moving my broadband account this week as I have no desire to deal with a Company who appear to have little or no regard for their customers........lots of hollow sound bites......and that's about it. Given time, they can only hang themselves and end up with no customers other than those that have no choice but to deal with them.
I called up their chart this morning and was staggered to see how much progress their share price has made since February 2009....I've set an alert close to the 0.618 Fibonacci level (230p)and if it gets to that level...I'll be shorting it very aggressively.
Unfortunately, I have to report that the customer service I received from BT (and in particular their off-shore call centre) and only be described as atrocious!...
I will be moving my broadband account this week as I have no desire to deal with a Company who appear to have little or no regard for their customers........lots of hollow sound bites......and that's about it. Given time, they can only hang themselves and end up with no customers other than those that have no choice but to deal with them.
I called up their chart this morning and was staggered to see how much progress their share price has made since February 2009....I've set an alert close to the 0.618 Fibonacci level (230p)and if it gets to that level...I'll be shorting it very aggressively.
Friday, February 24, 2012
EURCHF Update (2)
It's Friday......7pm....I've looked at the price behaviour of this trade...and, as you can see, progress has been made. There is a downtrend line which has acted as resistance 6 times and three bear flags.....so whilst I was considering closing the trade before the weekend, technically, there is no reason to do so.....I shall therefore leave it running and hope for further progress on Monday. I have, however, moved my stop to break even.
Geometry in the Markets
I am a very keen user of both geometrical and time patterns in trading. The chart below shows a simple AB=CD pattern. The D completion point was on 22nd December and ideally one would like the price to be at the completion level at that time. In this instance it was just 7c below it. That was enough to attract my interest. If you follow the dotted line across from the D point you can see that the price reacted at the level on 4th January and again on the 10th January before finally collapsing. This gave added confidence to trade a reversal funnel. the price fell 15% in 6 days.
EUR/CHF Update
I am still in my EURCHF trade. The price action so far has been encouraging even though the breakout hasn't been spectacular.
The yellow area shows that the price reacted at my previously predicted "congestion" area. The green circle is a classic action with this pattern...where the price retraces to the funnel level (sometimes it goes into the middle of the funnel or even to the top)....I refer to the green circle level as " a second chance entry" and sometimes I look for these as entry points instead of the initial breakout).
So.....technically speaking, there is no reason to take any action today. However, as today is Friday, I will monitor the trade and make a decision later today as to whether |I should leave it running over the weekend or close it before COB tonight.
The yellow area shows that the price reacted at my previously predicted "congestion" area. The green circle is a classic action with this pattern...where the price retraces to the funnel level (sometimes it goes into the middle of the funnel or even to the top)....I refer to the green circle level as " a second chance entry" and sometimes I look for these as entry points instead of the initial breakout).
So.....technically speaking, there is no reason to take any action today. However, as today is Friday, I will monitor the trade and make a decision later today as to whether |I should leave it running over the weekend or close it before COB tonight.
Thursday, February 23, 2012
Last night I entered a new trade on EUR/CHF. I went short at the breakout of a funnel pattern. Sometimes these patterns drop quickly to their target...other times they meet "congestion" on their way...often at forecasted levels. We'll have to wait and see. If it works, my profit take order is already in place and it will be a nice trade in terms of RRR. If not my stop is in place and I'll be taken out.
Wednesday, February 22, 2012
Schroders' 1 hour chart
Here is an example of a "Fibonacci funnel" on a 1 hour chart of Schroders, LSE. The trade was a success and it gave a RRR 4.77 to 1 ahhhhh...if only they were all like that!
Another complete pattern
This is another "Fibonacci funnel" but this time on a 2 hourly time frame. You can see that the price traded to within 2 ticks of the target. (I always set my limit order to be filled a little below the target...- "shading it") and this trade produced a RRR of 3.1 to 1 in a matter of 6 calendar days / 4 trading days.
Subscribe to:
Posts (Atom)


.png)
.png)
.png)
.png)
.jpg)
.jpg)

+1.jpg)

.png)